In this blog post, I’ll cover how OpenNMS Meridian can leverage SNMP network monitoring. SNMP or the Simple Network Management Protocol works as a client-server model where clients or agents provide information back to a central management server, Meridian, in our case. The management server can query specific information and events from the agents.
By default, Meridian collects information from SNMP devices of Report 161 and uses a read community string of “public.” As a best practice, though, community strings should be changed to something unique on your network devices. Meridian provides support for SNMP versions 1, 2c, and 3.
What is SNMP Network Monitoring?
SNMP is a protocol for collecting, managing, and organizing information for network devices. It's a common standard for network monitoring. SNMP can help network administrators identify overloaded network connections and get alerts on hardware status, temperature, and potential failures.
Imagine you're a network administrator for a regional internet service provider, and you've got a group of customers who are complaining about intermittent service. It's possible to use SNMP data and Meridian to find out which connections are problematic. SNMP can also be used with servers to get information on resource usage, such as disk consumption and memory utilization. It is also used in data centers to get information from power supplies, AC units, and many other systems.
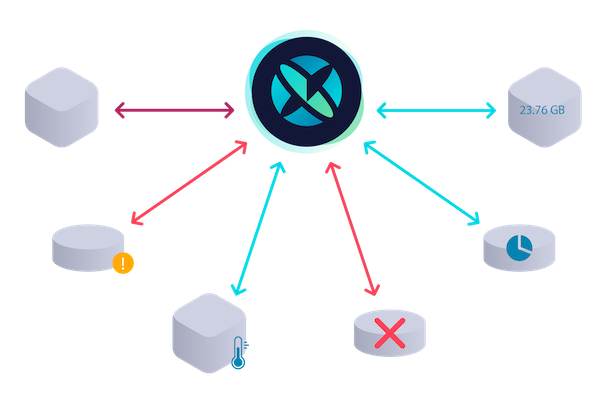
SNMP Monitoring Components
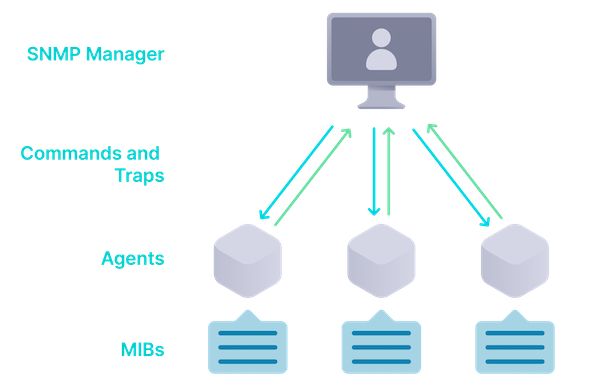
SNMP has five major components:
- Managers (command generator)
- Agents (command responder)
- MIBs (management information base)
- Commands
- Traps
It might be useful to think about SNMP by imagining you're the coach or manager of a sports team. The SNMP manager, that's you. You're responsible for managing and monitoring the team's performance and making changes when necessary. SNMP agents are the individual players on your team. Each player or agent provides specific information about their performance to you, the manager, when requested.
You can think of MIB, or the management information base, as a playbook or record that helps maintain information about the players. It contains information like positions, stats, and potential actions the players might take in the game.
SNMP commands are like the instructions or requests you give to the players during the game. For instance, if you want to know how many goals a specific player has scored, you ask for that information. SNMP traps are like unsolicited updates from players during the game. For example, if a player gets injured, they notify you immediately so that you can make substitutions or adjust your strategy accordingly. For SNMP v3, the terms manager and agent change to command generator and command responder.
Collecting SNMP Network Device Data
By default, OpenNMS Meridian will discover and begin collecting SNMP network data from managed nodes using the default community string "public" and Port 161. Meridian collects data every five minutes and stores it in RRD files. The collection interval can be changed to enable faster or slower collection. The data can also be stored in a time series database, which we'll explore later.
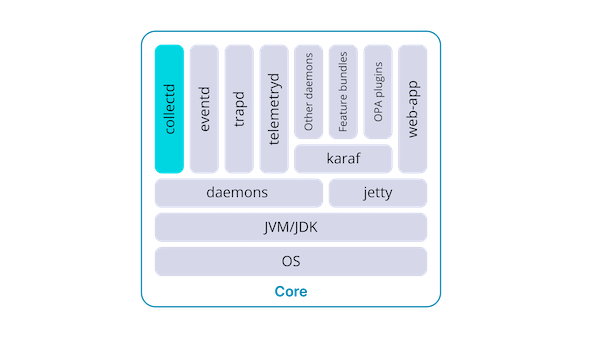
The collectd or collection daemon within OpenNMS is responsible for collecting SNMP network data. Though we often refer to SNMP polling, collectd collects information and stores it within the RRDs. Pollerd or the poller daemon is used for service assurance and verifies the SNMP service is running on monitored devices.
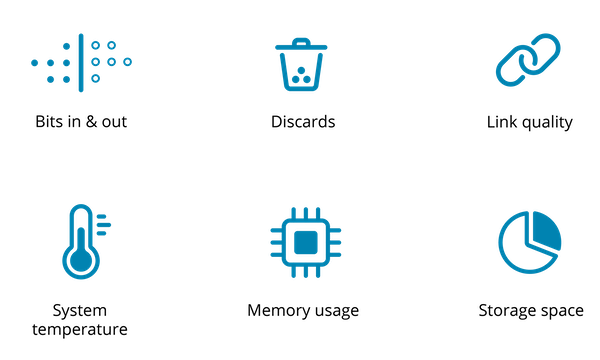
Meridian can collect things like bits in and out, discards or errors, link quality (particularly useful for fiber optic links), system temperature, memory usage, storage space, and more, depending on what the device provides.
Collecting SNMP Network Trap Data
In addition to collecting data from SNMP devices, Meridian can also collect SNMP traps. Traps are events sent from devices with SNMP to a collector or a server, and Meridian can process them as events. The event definitions that Meridian uses come from the MIBs provided to it.
Events are structured historical records of things that happen in Meridian, along with the nodes, interfaces, and services it monitors. They are central to the operation of Meridian, and it's safe to assume that whenever something in Meridian appears to be working by magic, it's probably events working in the background. You can use events to send notifications, trigger automation, and translated into other events.

Storing SNMP Network Performance Data
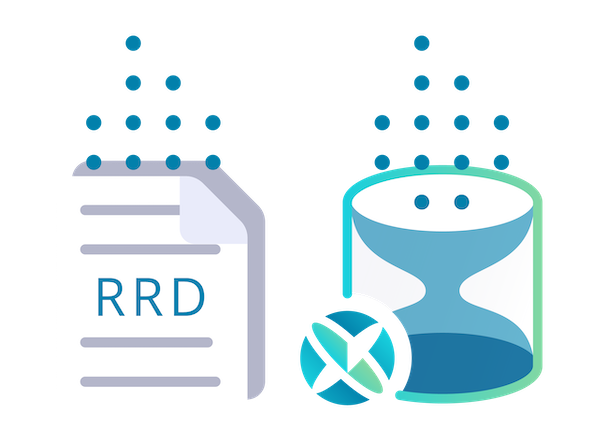
Performance data in Meridian can be stored using time series databases. By default, Meridian uses RRD files to store collected data. For small to medium-sized customers and users just looking to kick the tires, RRDs are a great option. They're incredibly performant, take up little disc space, and work out of the box.
If users want to set up their own time series database, we provide a component for Apache Cassandra called Newts that can be leveraged. This requires installing and maintaining an Apache Cassandra cluster. We also provide community support for Cortex and compatible derivatives, such as Prometheus and Thanos.
Meridian overcomes the challenges of collecting large amounts of SNMP data by distributing collection across minions. Minions are lightweight, stateless services that add monitoring capacitance and reduce the load on the Meridian core. By enabling horizontal scaling of collection, minions can be deployed as virtual machines, containers, or even physical servers. Minions can also enable collection from overlapping subnets.
Conclusion
We've covered the insight and intelligence that can be gained by using OpenNMS Meridian with SNMP network monitoring. However, OpenNMS Meridian goes beyond just flows and SNMP. It can ingest telemetry, syslog data, WMI, JDBC, JMX, and much more. OpenNMS Meridian is the ideal platform to provide holistic insight into your network.
If you just want to try it yourself, look at OpenNMS Horizon, our open-source, community-supported edition, where we constantly add product enhancements before they reach stability in our enterprise-grade product, Meridian.
