In today's complex IT environments, monitoring goes beyond just checking if a server is up. We're flooded with data from every corner of our network, from traditional SNMP devices to modern APIs and cloud services. The real challenge isn't just collecting this data—it's making sense of it. While OpenNMS is a powerhouse for discovery, data collection, and event management, visualizing that data in a way that provides immediate, actionable insights can be a different story.
This is where Grafana comes in. By pairing OpenNMS as your robust data collection and event engine with Grafana as your flexible and dynamic visualization layer, you can create a unified monitoring solution that is both powerful and intuitive. This post will show you why this combination is a perfect match and how you can get started, using a real-world example to illustrate the process.
Why OpenNMS and Grafana Together?
Think of OpenNMS and Grafana as a tag team. Each tool excels in its own arena, and together, they cover all the bases of a comprehensive monitoring strategy.
- OpenNMS's Role: The Data Engine. OpenNMS is built for scale and reliability. Its strengths lie in:
- Extensive Data Collection: It can ingest metrics from almost any source (SNMP, Prometheus, JMX, etc.).
- Automated Discovery: It can automatically find and provision devices on your network.
- Event and Alarm Management: It processes events, correlates them into alarms, and notifies the right people.
- Grafana's Role: The Visualization Layer. Grafana is a front-end designed for one thing: making data beautiful and understandable. Its key features include:
- Complex Dashboards: Create complex and customizable dashboards (graphs, gauges, heatmaps, etc.).
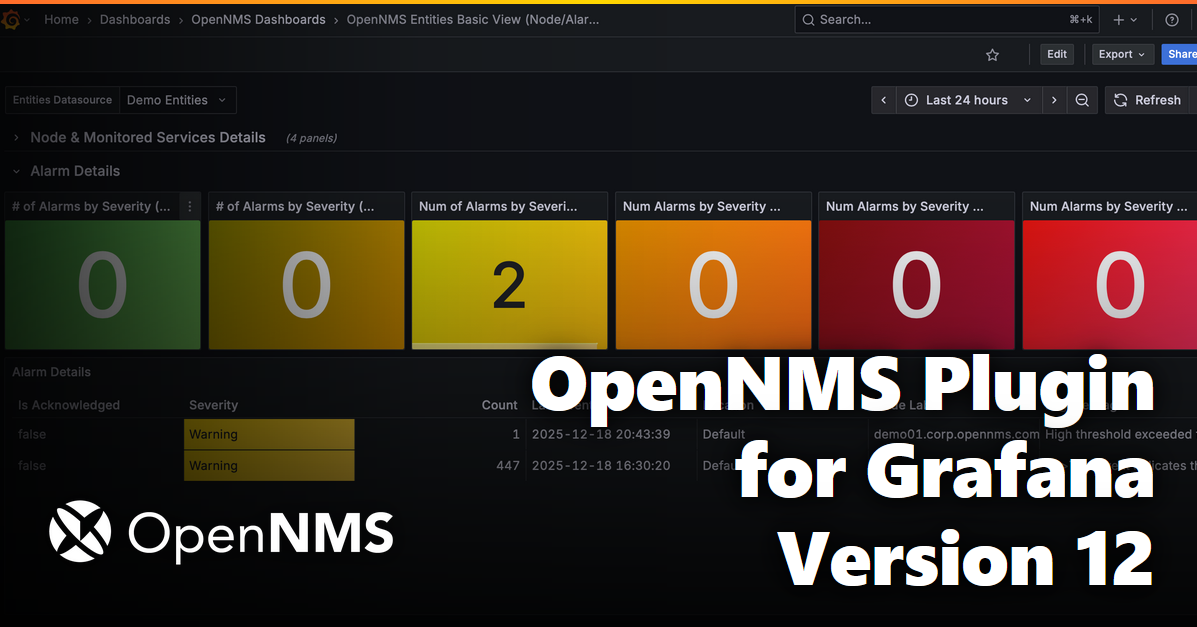
- Multi-Source Support: It pulls data from OpenNMS using the OpenNMS Plugin for Grafana and it can even pull directly from some OpenNMS time-series backends, like Prometheus.
- Advanced Querying: Use queries languages like PromQL or ElasticQL to perform calculations and filter for deeper insights.
By combining the two, OpenNMS handles the heavy lifting of collection and event management, while Grafana provides the perfect interface for visualizing that data in a single, unified view.
Three Common Use Cases: A Quick Look
OpenNMS excels at collecting data from a variety of sources. Here's how you can use OpenNMS collectors with Grafana for some common monitoring needs.
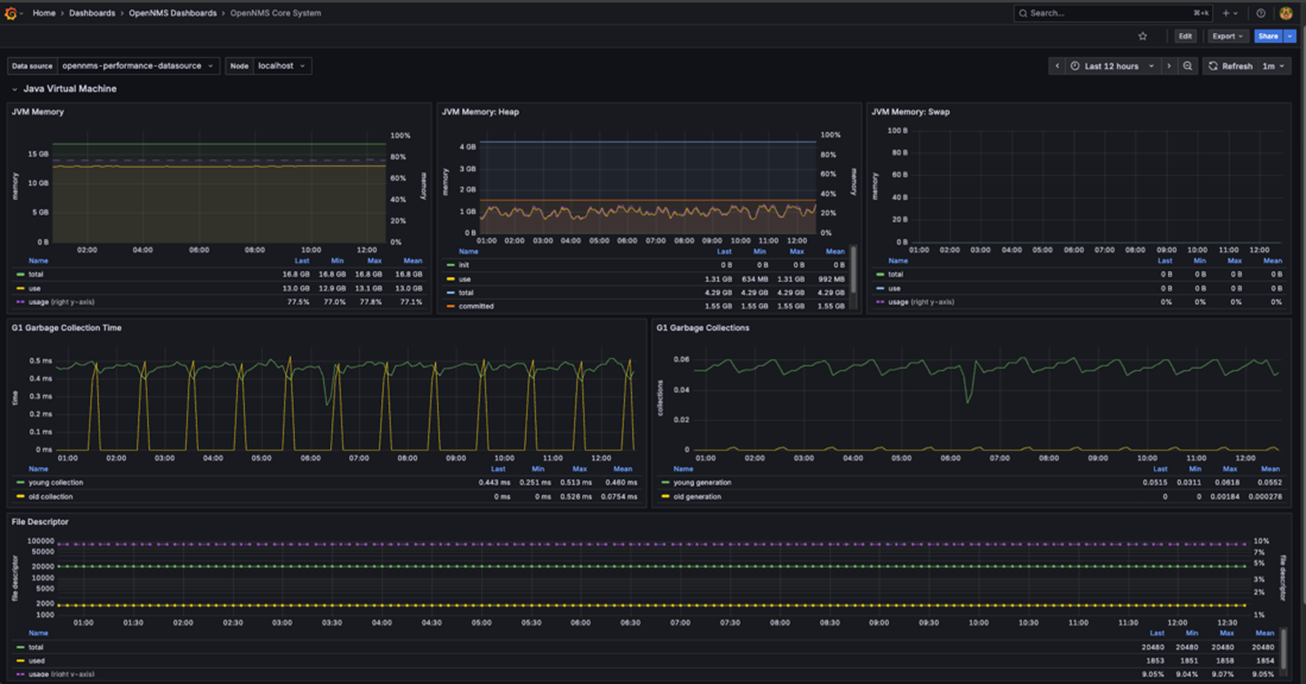
1. JMX for Java Applications ☕️
- Problem: Monitor Java application performance (e.g., Kafka, Tomcat).
- Solution: OpenNMS's JmxCollector scrapes metrics like memory usage, garbage collection stats, and thread sizes.
- Payoff: Visualize real-time heap usage and thread counts in a Grafana dashboard for a clear view of application health.
2. SNMP for Network Devices📈
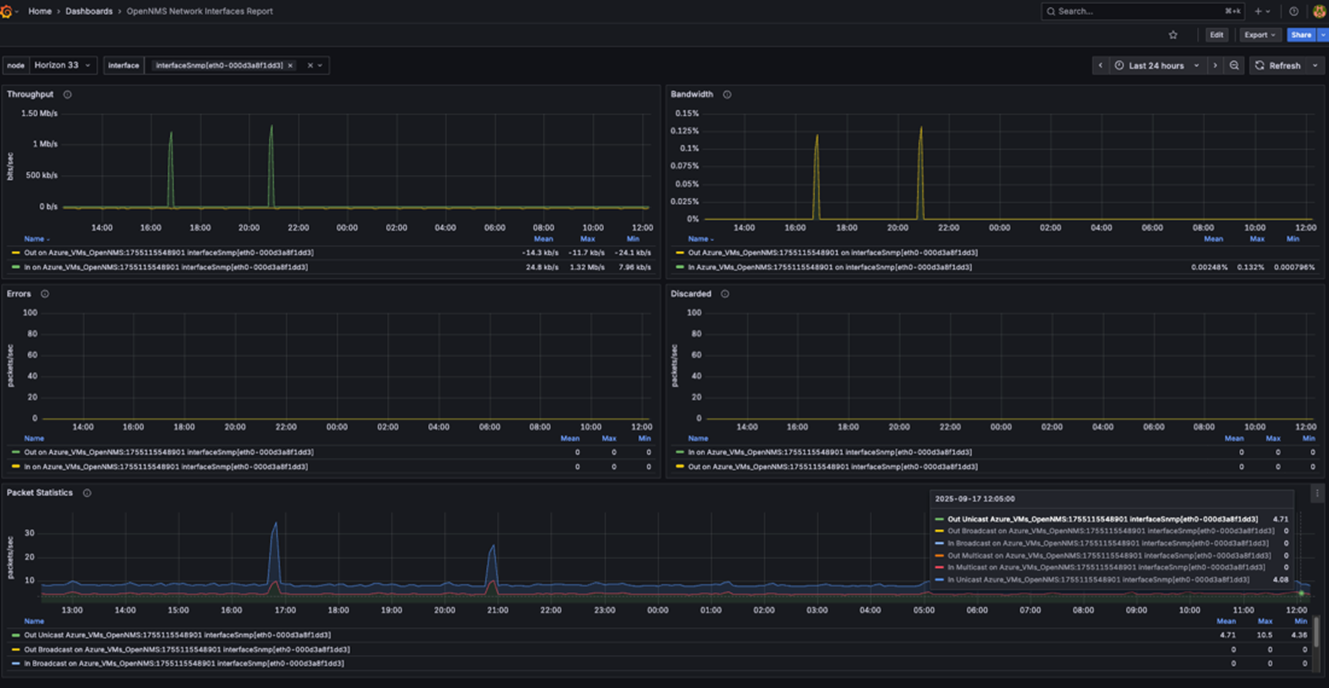
- Problem: Track network bandwidth on routers and switches.
- Solution: The SnmpCollector polls devices for metrics like interface traffic.
- Payoff: Create a "Network Traffic" dashboard in Grafana with graphs showing historical bandwidth usage and gauges for real-time traffic.
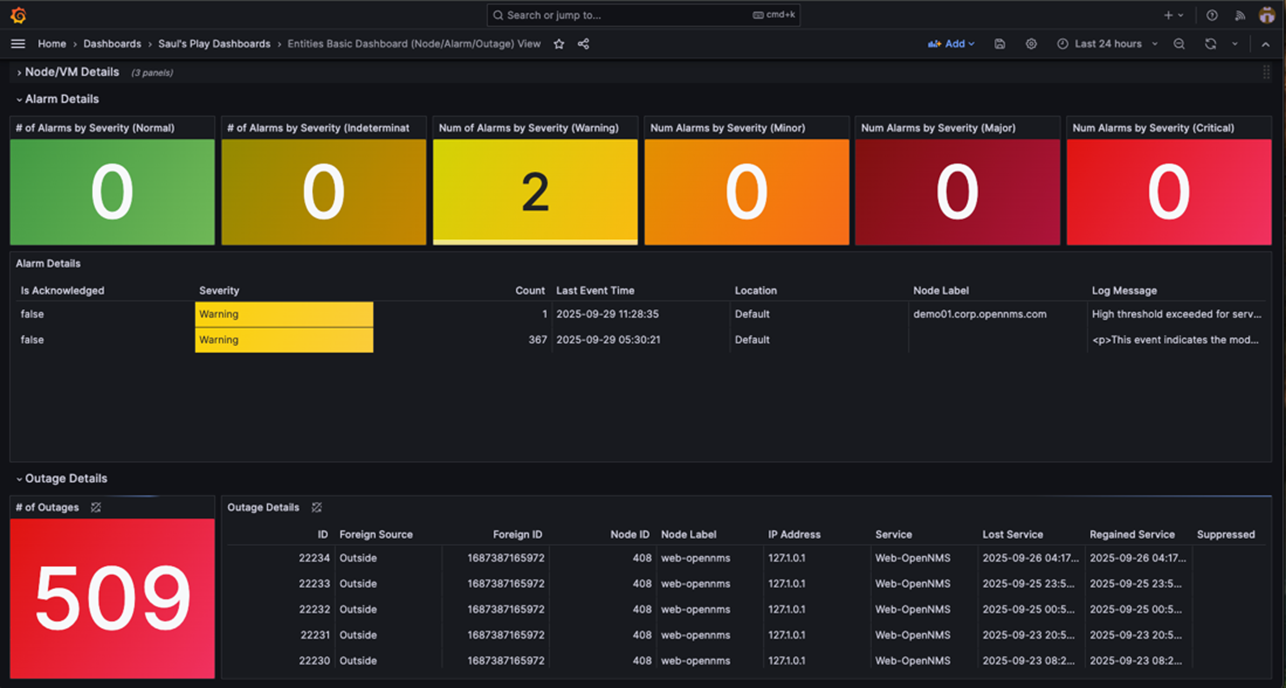
3. Alarm/Event Data Visualization 🚨
- Problem: You need a high-level view of active alarms across your entire network, including historical trends.
- Solution: OpenNMS processes incoming events and creates alarms. Using the OpenNMS Grafana plugin, you can query this event and alarm data directly.
- Payoff: Build a "Network Health" dashboard in Grafana with panels showing the count of open alarms by severity, a timeline of recent critical events, and a breakdown of alarm categories.
Beyond the Use Case: The Bigger Picture
This isn't just a solution for one specific problem. The OpenNMS and Grafana combination can be applied to a wide range of monitoring needs, including:
- IoT Device Monitoring: Collect and visualize data from sensors and smart devices.
- Application Performance: Track key metrics for your applications and microservices.
- Business KPIs: Monitor metrics directly tied to your business's success.
- Network Operations Center (NOC) Dashboards: Create a single-pane-of-glass view for your entire infrastructure.
This flexibility highlights OpenNMS's evolution from a network monitoring tool to a robust data collection platform, capable of handling virtually any time-series data you need.
Conclusion
If you're looking for a more powerful way to visualize your monitoring data, look no further than the dynamic duo of OpenNMS and Grafana. You can leverage OpenNMS's deep capabilities for data collection and event management while gaining the unparalleled visualization and dashboarding power of Grafana.
Ready to see what else OpenNMS can do for you? Check out our documentation and start building your unified monitoring solution today. Or contact us to set up a demo and learn how OpenNMS Meridian can make it easier to monitor your enterprise network.
